
Experimentation in Fintech: A Guide to Sequential Testing

As a product data scientist for fintech,
I ran 100+ experiments to make data-driven decisions that improved customer experiences and business outcomes.
These tests helped us learn what worked, whether it was improving loan application designs or tweaking pricing strategies to boost customer loyalty.
One of the most impactful methods I used in some of these tests was sequential testing, which helped us make timely decisions while ensuring the results remained reliable.
Before We Talk About Sequential Testing
Let's first discuss what experimentation is and how I use A/B and sequential testing to make data-driven decisions.
Note: Check out my previous guide to run A/A test experiments.
A/B Testing
A/B testing is a method of experimentation that compares two versions of a product or feature to determine which one performs better. For example, we might test two versions of a loan application form to see which one results in higher conversion rates.
The key to successful A/B testing includes:
Clear Success Metrics: Defining KPIs such as conversion rates or revenue uplift.
Controlled Environment: Ensuring both versions are tested under similar conditions to minimize bias and produce reliable results.
Statistical Rigor: Using tools like a t-test or z-test to determine significance once the experiment concludes.
Sequential Testing
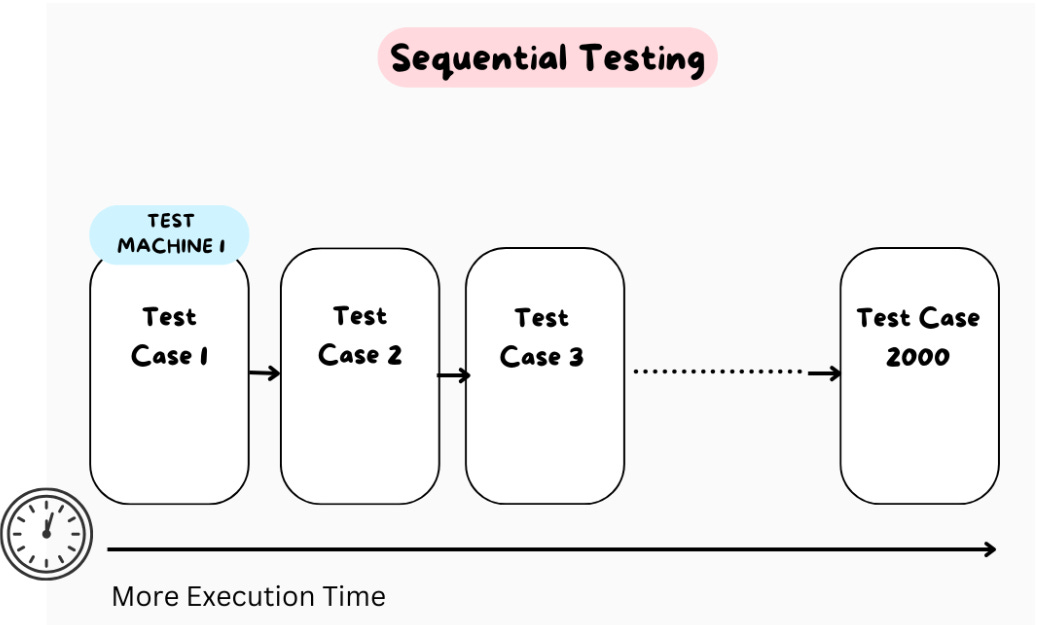
Sequential testing is an extension of traditional A/B testing.
In regular A/B testing, you wait until all the data is collected before analyzing results.
In sequential testing, you analyze data at predefined intervals during the test.
This approach allows for faster decision-making without compromising the reliability of results.
Key Advantage:
If early data indicates a clear winner (or loser), the test can be stopped early, saving time and resources while still maintaining statistical validity.
Objective: Optimized Pricing for a New Loan Product
For this test, the goal was clear: determine if a new pricing model could drive higher customer conversions and boost revenue.
However, the stakes were high, and we couldn’t afford to wait weeks for conclusive results. We needed real-time insights to make quicker, smarter decisions.
The Approach: Sequential Testing
We had run countless A/B tests before, but this time, we decided to implement sequential testing to introduce flexibility.
By adapting to early data trends, we avoided the wait for the full sample, which is standard in traditional testing.
How We Used Sequential Testing: A Step-by-Step Journey
1. Setting Clear Stopping Rules
To ensure the test would be actionable, we established clear go/no-go rules:
Success: The new pricing showed a statistically significant improvement in conversion rates.
Futility: If data indicated the goals wouldn’t be met, the test could be stopped early, conserving resources.
We implemented a Bayesian decision framework alongside traditional hypothesis testing to evaluate probabilities of success or failure at each checkpoint.
2. Adjusting the Significance Levels
We adopted the O’Brien-Fleming method for dynamic p-value thresholds:
Early in the test, thresholds were set conservatively (e.g., p < 0.01).
As more data became available, the thresholds relaxed (e.g., p < 0.05).
This method ensured early decisions wouldn’t lead to false positives or negatives.
3. Tools used: SQL and Python
For Real-Time Tracking and Analysis:
SQL
Used SQL queries to collect live data from customer interactions with the loan application forms.
Designed pipelines to aggregate key metrics like conversion rates, customer segments, and revenue uplift for seamless integration into the analysis workflow.
Example Query:
WITH customer_data AS (
    SELECT
        customer_id,
        application_date,
        pricing_model,
        conversion_flag
    FROM
        loan_applications
    WHERE
        test_group IN ('control', 'variant')
)
SELECT
    pricing_model,
    COUNT(*) AS total_applications,
    SUM(conversion_flag) AS total_conversions,
    ROUND(SUM(conversion_flag) * 100.0 / COUNT(*), 2) AS conversion_rate
FROM
    customer_data
GROUP BY
    pricing_model;
Python
Leveraged Python libraries like
pandasandnumpyfor data preprocessing and statistical analysis.Used
scipy.statsfor hypothesis testing (z-tests and t-tests) and real-time calculations of confidence intervals.Visualized results dynamically with
matplotlibto track performance trends over time.
Example Python Workflow:
import pandas as pd
import numpy as np
from scipy.stats import ttest_ind, norm

# Load Data from SQL Query
data = pd.read_csv("pricing_test_data.csv")

# Calculate Conversion Rates
control = data[data['pricing_model'] == 'control']['conversion_flag']
variant = data[data['pricing_model'] == 'variant']['conversion_flag']

# Conduct Statistical Test
t_stat, p_value = ttest_ind(control, variant, equal_var=False)

# Print Results
print(f"T-Statistic: {t_stat}, P-Value: {p_value}")

# Visualize Results
import matplotlib.pyplot as plt
plt.bar(['Control', 'Variant'], [control.mean(), variant.mean()])
plt.title('Conversion Rate Comparison')
plt.ylabel('Conversion Rate')
plt.show()
4. Decision Points
We evaluated results at predefined intervals, such as every 100 customer conversions. At each checkpoint:
Success: If the new pricing was significantly better, we stopped the test and implemented the new strategy across all segments.
Failure: If results underperformed or didn’t reach significance, we pivoted to other strategies.
Technical Takeaways
Stopping Rules:
Defined clear thresholds for success and futility to determine when to stop the test.
Used statistical methods implemented in Python (
scipy.stats) to calculate p-values and confidence intervals dynamically during the experiment.
Real-Time Monitoring:
Automated data ingestion using SQL to collect live data from customer interactions, aggregating key metrics like conversion rates and revenue uplift.
Conducted statistical analyses and visualized results in Python using libraries like
pandas,numpy, andmatplotlibfor real-time decision-making.
Statistical Analysis Pipeline:
Combined SQL data pipelines with Python’s robust statistical testing capabilities for seamless integration.
Enabled quick identification of trends and ensured every decision was grounded in reliable data.
Sequential testing provided faster decisions and data-backed confidence, ensuring we could act decisively in a competitive market while saving resources and optimizing business outcomes.