
Margin of Error and Its Association with Sample Size: A Key Factor in Product Launch Decisions

Introduction
In the fast-paced world of technology, decisions about product launches can make or break a company’s momentum.
Whether it’s a new smartphone, an app update, or a software feature rollout, making sure the launch hits the mark is crucial.
But how can companies predict with confidence how successful their product will be? This is where statistics plays a vital role, particularly through concepts like margin of error and sample size.
Let’s dive into the critical relationship between sample size and margin of error, and how understanding this association helps tech companies make informed decisions for product launches.
1. Understanding Margin of Error
Before exploring how margin of error affects product launches, it’s important to clarify what margin of error actually means.
Definition: What Is Margin of Error?
The margin of error indicates how much the results of a survey or test may vary from the true value of the population being studied. It shows the range within which the real result is likely to fall, given a certain confidence level (typically 95%). The smaller the margin of error, the more precise the results.
For example, in a survey about user satisfaction with a new product, if 60% of users say they are satisfied with a margin of error of ±5%, this means the true satisfaction rate lies between 55% and 65%.
Why Does Margin of Error Matter?
When companies collect feedback from customers or test new products, the margin of error is a measure of the uncertainty in the results. A smaller margin of error increases confidence that the observed results represent the broader population. In product launches, this can mean the difference between a smooth release or a decision to halt further development.
2. The Role of Sample Size in Reducing Margin of Error
The margin of error is inversely related to the sample size. In simpler terms, as the sample size increases, the margin of error decreases. This is because larger sample sizes capture more data points from the population, making the results more accurate and reducing the uncertainty.
The association between sample size and margin of error is illustrated clearly in the following chart:
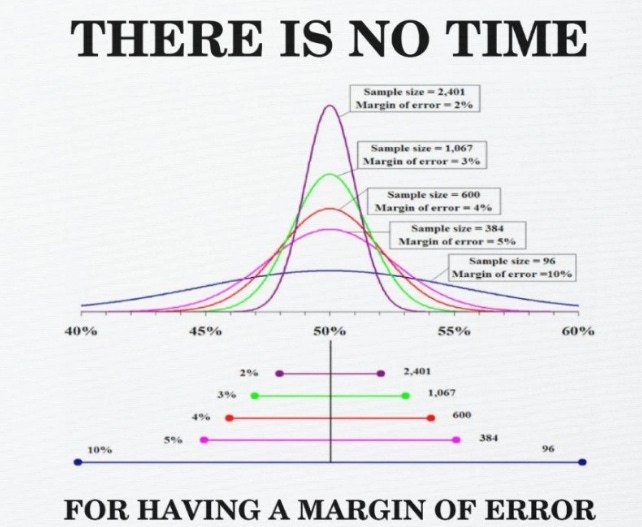
3. Explanation of the Chart
The chart shows how different sample sizes affect the margin of error in a survey or test. Each bell curve and horizontal range corresponds to a different sample size, showing the impact it has on precision:
Sample Size = 2,401 (Margin of Error = ±2%):
This is the largest sample size with the smallest margin of error. The bell curve is the narrowest, showing that there’s minimal variation in the results. The range (±2%) indicates high confidence in the results.
Sample Size = 1,067 (Margin of Error = ±3%):
This is a smaller sample size than 2,401 but still quite large. The margin of error is ±3%, meaning there's still good precision, but slightly more room for uncertainty compared to the largest sample size.
Sample Size = 600 (Margin of Error = ±4%):
With 600 participants, the bell curve begins to widen. A ±4% margin of error means that there is greater uncertainty in the results compared to larger samples. Companies may still proceed with some caution but are starting to gather significant information.
Sample Size = 384 (Margin of Error = ±5%):
A sample of 384 produces a ±5% margin of error, meaning results can vary more significantly. This is where decision-making becomes trickier, as there’s more room for error in interpreting user reactions.
Sample Size = 96 (Margin of Error = ±10%):
This is the smallest sample size with the largest margin of error. The bell curve is the widest, showing a ±10% uncertainty range. This means results are highly variable, making it difficult to confidently predict the population’s reaction.
Key Insight: As the sample size increases, the margin of error decreases, resulting in more reliable and accurate data. Companies testing products before a launch should aim for larger sample sizes to minimize uncertainty and improve decision-making.
4. Why Does Sample Size Matter for Product Launches?
When launching a product, tech companies need to make several decisions that could impact the product's success:
Should we launch the product globally, or start with a smaller market?
Are users responding positively to the product in the beta stage?
Do we need to make more improvements before the full rollout?
Making these decisions requires reliable data. But how can companies be sure their test results or user feedback truly reflect the broader market’s response? This is where sample size comes into play.
Example: A Tech Product Launch
Let’s consider a real-life scenario of a product launch by a tech company like Spotify.
Spotify’s Launch of a New Feature
Let’s now expand on the tech example with a deeper dive into Spotify’s launch of a new social sharing feature. The goal is to understand how sample size and margin of error can guide decisions at every stage of a product rollout—from testing in a small market to global launch. This is a step-by-step approach with key product launch questions, data-driven decisions, and the role of margin of error in ensuring confidence.
Question 1: Should We Launch the Feature Globally or Start with a Small Market?
Spotify has a new feature ready but wants to minimize the risk of a poor global launch. The strategy is to first test the feature in a smaller market, gathering enough data to assess its potential for a broader release.
Scenario 1: Initial Launch in a Small Market (Small Sample Size = 96 users, Margin of Error = ±10%)
Step 1: Small Audience Test
Spotify selects a small market, such as a city with a high density of users, to conduct an initial launch. They survey 96 users who interact with the new feature.
Results: 60% of users report positive feedback. However, due to the small sample size, the margin of error is ±10%, meaning the real satisfaction rate could range between 50% and 70%.
Decision Impact:
Risk: A satisfaction rate of 50% would suggest that half the users dislike the feature—an indication that it might need significant improvement before a wider launch. On the other hand, a satisfaction rate of 70% would show solid interest in the feature.
Next Step: The high margin of error introduces uncertainty. Spotify should consider further testing before proceeding globally. Based on this data, they might decide to hold off on the global rollout and first improve specific elements of the feature. Alternatively, they may expand to a slightly larger test audience for more accurate data.
Scenario 2: Expanded Test (Larger Sample Size = 1,067 users, Margin of Error = ±3%)
After making some improvements, Spotify tests the feature on a larger scale—expanding the sample to include 1,067 users in multiple small markets.
Results: 68% of users report positive feedback. The margin of error decreases to ±3%, meaning the real satisfaction rate lies between 65% and 71%.
Decision Impact:
With a margin of error of ±3%, Spotify can confidently predict the success of the feature with more precision. They are now in a position to consider launching the feature in larger markets or even globally, knowing the feedback is more reliable. This reduced uncertainty provides a clear path forward for broader adoption.
Scenario 3: Extensive Test (10,000 Surveys, Margin of Error = ±1%)
At this stage, Spotify decides to scale the test even further, conducting a survey with 10,000 users. By gathering a larger sample size, the margin of error is reduced to ±1%.
Results: If 66% of users are satisfied, the true satisfaction rate would be between 65% and 67%. This level of precision means that Spotify now has an almost definitive understanding of user sentiment toward the feature.
Decision Impact:
The ±1% margin of error gives Spotify high confidence that the feature will succeed in a global launch. Given the minimal uncertainty, Spotify can proceed with a full-scale rollout, confident that a majority of users will find the new feature valuable.
Question 2: Is the Feature Ready for a Full Rollout, or Does It Need Improvement?
After gathering data from small and medium-sized test groups, Spotify must decide whether to roll out the feature broadly or continue making refinements based on user feedback.
Scenario 1: Sample Size = 600 Users, Margin of Error = ±4%
Spotify conducts a test with 600 users. The feedback shows 65% satisfaction, but the margin of error is ±4%, meaning the true satisfaction rate could be as low as 61% or as high as 69%.
Decision Impact:
The ±4% margin of error suggests that the data is somewhat reliable, but there’s still enough room for uncertainty. With this data, Spotify might opt for a limited rollout in key markets where the feature’s success is more likely. This gives the company a chance to continue collecting feedback and potentially refine the feature before committing to a global launch.
A limited rollout could serve as an intermediate step, helping the company fine-tune aspects of the feature that need improvement while avoiding the risks associated with a full launch.
Scenario 2: Sample Size = 2,401 Users, Margin of Error = ±2%
With an even larger sample size of 2,401 users, the margin of error drops to ±2%. In this case, 66% of users like the feature, meaning the true satisfaction rate lies between 64% and 68%.
Decision Impact:
With a ±2% margin of error, Spotify can move forward with a full rollout of the feature. The small margin of error provides the confidence that user satisfaction is consistent across the board, making it less likely that the product will fail post-launch.
The precise results minimize the risk of misjudging user preferences, allowing the company to scale up with confidence.
Question 3: How Confident Are We That User Preferences Are Accurate?
Understanding user preferences is essential to creating a successful product, but confidence in the accuracy of data depends heavily on the sample size.
Scenario 1: Sample Size = 384 Users, Margin of Error = ±5%
In this scenario, 62% of users like the feature, but the margin of error is ±5%, meaning the true satisfaction rate could range between 57% and 67%.
Decision Impact:
A ±5% margin of error introduces enough uncertainty that it could be dangerous to proceed with a full rollout. With satisfaction potentially dipping as low as 57%, Spotify might decide to delay the launch and conduct additional testing to gather more data. This could involve testing the feature on a different group of users or expanding the current test to more markets.
Scenario 2: Sample Size = 10,000 Surveys, Margin of Error = ±1%
With 10,000 users surveyed, the margin of error drops to ±1%, giving Spotify highly accurate data. If 65% of users are satisfied, the true satisfaction rate would be between 64% and 66%.
Decision Impact:
With a ±1% margin of error, Spotify can confidently move forward with a global rollout, as the small margin of error means user preferences are highly consistent and predictable across the population.
This level of precision allows Spotify to proceed with minimal risk, knowing that even if there are slight differences in preferences across different regions, the feature is likely to be well-received.
6. Practical Implications for Product Launch Decisions
The example with Spotify shows why understanding the association between sample size and margin of error is critical in product launches. Here’s how this relationship directly impacts decision-making:
More Accurate Insights: Larger sample sizes yield smaller margins of error, which means companies can trust their test results more. For example, if feedback from 10,000 users shows a margin of error of ±1%, it gives Spotify confidence that the feature is popular across the broader user base.
Informed Go/No-Go Decisions: A product launch requires a high degree of confidence that users will accept and engage with the product. If the margin of error is too large due to a small sample size, companies risk launching products that users may not like, leading to wasted resources and a potential hit to the brand’s reputation.
Reducing Risk: High-margin-of-error results could lead to wrong assumptions about user preferences, increasing the risk of product failure. Larger sample sizes help mitigate this risk by providing more reliable data.
7. Conclusion: The Critical Link Between Sample Size and Product Success
In the tech world, launching a product is never a gamble—it’s a calculated decision based on data. Understanding the relationship between sample size and margin of error is critical to making these decisions with confidence. A larger sample size reduces the margin of error, which provides clearer, more reliable insights into how users feel about a product.
As seen in the example of Spotify’s new social sharing feature, when companies invest in testing with larger samples, they can be more certain about their product’s success and launch with confidence. A product launch backed by robust data and a small margin of error is far more likely to succeed in a competitive marketplace, where the stakes are high and user preferences are constantly evolving.
In today’s data-driven tech industry, the margin of error is not just a statistic—it’s a key factor in predicting the success or failure of a product. Therefore, understanding and applying this concept is essential for any company looking to make informed, confident product launch decisions.
Need help ?
referrals → Join
Student Scholarships → Resources
Hiring updates → Job board
Follow on Linkedin