


The Power of Standard Deviation: A Guide to Data Validation in Technology

Standard deviation (STD) is an important concept in statistics, often used to measure how spread out the values in a dataset are.
Whether you are working with app load times, user login rates, or website traffic, standard deviation helps you understand if your data points are close to the average (mean) or if they are scattered widely.
This post will dive into standard deviation, explore what it means when data falls within 1, 2, or 3 standard deviations, and explain how it’s used for data validation in tech companies. We'll also cover its limitations and related concepts to give a well-rounded understanding.
Overview of Standard Deviation
What it is:
Standard deviation tells you how spread out the numbers in a dataset are. When the standard deviation is small, it means most of the data points are close to the mean, showing consistency. When it’s large, the data points are spread out, indicating more variability.
Small standard deviation: Data points are closer to the mean.
Large standard deviation: Data points are more spread out from the mean.
For example, if the average load time for an app is 3 seconds, a small standard deviation indicates that most users experience load times close to 3 seconds. A large standard deviation means some users are having widely different load times.
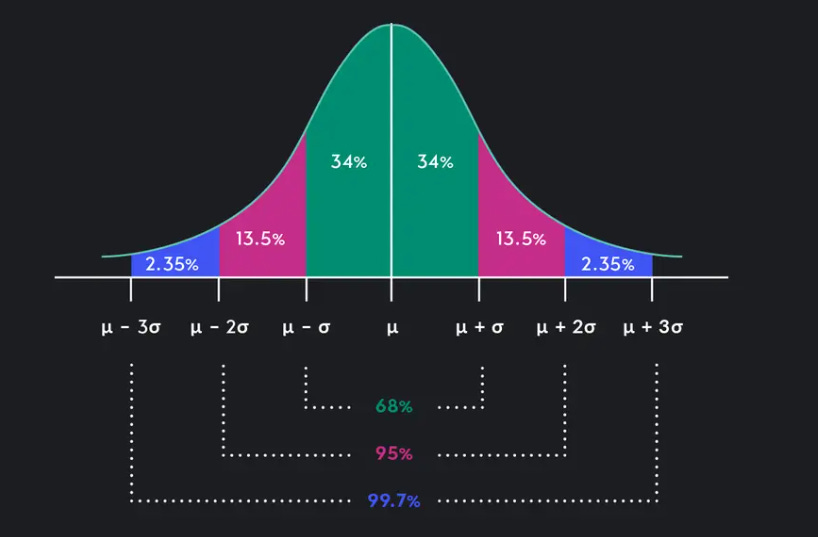
1, 2, and 3 Standard Deviations: Understanding the Spread
Source: outlier
In datasets that follow a normal distribution (bell curve), standard deviation can help us understand the spread of data in three key ranges:
Within 1 Standard Deviation (68%):
Around 68% of data points fall within 1 standard deviation of the mean.
Example: If the average load time is 3 seconds and the standard deviation is 0.5 seconds, 68% of users will experience load times between 2.5 and 3.5 seconds.
Within 2 Standard Deviations (95%):
Around 95% of data points fall within 2 standard deviations of the mean.
Example: About 95% of the app’s load times will be between 2 and 4 seconds.
Within 3 Standard Deviations (99.7%):
Almost 99.7% of data points fall within 3 standard deviations.
Example: Most load times (99.7%) will be between 1.5 and 4.5 seconds.
This breakdown helps tech companies identify what "normal" behavior looks like for their systems and allows them to spot outliers or performance issues that fall outside of these ranges.
Using Standard Deviation for Data Validation
Transaction Failure Rates (Fintech)
Use: Track how often financial transactions, such as payments or transfers, fail for users.
Validation: If the failure rate stays within 1 or 2 standard deviations, things are running smoothly. A spike outside this range could indicate a payment gateway outage or system bug.
Action: An unexpected increase would trigger checks for malfunctioning payment systems or network issues affecting certain banks or processors.
Credit Card Approval Times (Fintech)
Use: Monitor the time it takes to approve credit card applications.
Validation: Consistent approval times lead to a small standard deviation, showing the system is working efficiently. A larger standard deviation indicates possible slowdowns, perhaps due to system bottlenecks or verification delays.
Action: Delays in approval times outside the usual range would prompt system optimization or investigation into third-party integration issues.
Loan Repayment Delays (Fintech)
Use: Measure delays in customer loan repayments.
Validation: If delays remain within 2 standard deviations of the mean, the process is under control. A significant rise in delays outside this range could signal economic issues or processing problems.
Action: Investigate whether the issue stems from customer behavior, technical problems, or external factors affecting the payment system.
App Load Times (General)
Use: Track the time it takes for an app to load for users.
Validation: If the standard deviation is small, load times are consistent across users. An increase in standard deviation might indicate server issues or bugs affecting performance.
Action: A significant increase in deviation would prompt investigation into app performance and server load issues.
User Login Success Rate (General)
Use: Monitor how often users successfully log into an app.
Validation: When success rates are within 1 or 2 standard deviations of the mean, it indicates the login system is functioning properly. A sudden drop outside 2 standard deviations could signal problems.
Action: Technical teams would analyze the authentication system for bugs or server downtime that could be affecting login performance.
Website Traffic (General)
Use: Measure daily visits to a website.
Validation: Normal traffic fluctuations should fall within 2 standard deviations. Any large drop or spike outside this range could indicate broken tracking, server problems, or bot traffic.
Action: Investigate the root cause of unusual traffic patterns and take corrective action if necessary.
Advantages of Standard Deviation
Summarizes Data Variability:
Standard deviation gives a single, clear number that shows how much the data varies, making it easier to quickly understand the spread of the data.Works Well with Normal Distributions:
It’s especially helpful for datasets that follow a normal distribution, where you can expect 68%, 95%, and 99.7% of data points to fall within 1, 2, and 3 standard deviations, respectively.Widely Used:
In tech, finance, and many other industries, standard deviation is a go-to tool for tracking variability, identifying trends, and managing risks.
Limitations of Standard Deviation
Sensitive to Outliers:
Extreme values (outliers) can skew standard deviation, making it seem like there’s more variability than there really is. A single outlier can cause the standard deviation to become misleadingly large.Example: If most server response times are between 1-2 seconds, but one outlier is 100 seconds, the standard deviation will shoot up, even though it's just one unusual point.
Assumes Normal Distribution:
Standard deviation is most useful for normal distributions (bell curves). If your data is skewed or not evenly spread, standard deviation may not accurately reflect the variability.Example: In a tech company, user session lengths might be mostly short but have a few very long sessions, causing the data to be skewed. In such cases, standard deviation may not be the best measure.
Not a Standalone Tool:
Standard deviation works best when combined with other statistics like mean, median, or range to provide a fuller picture of the data.
Other Concepts Related to Standard Deviation
Variance:
Variance is the average of the squared differences from the mean. Standard deviation is just the square root of variance, but while standard deviation is easier to interpret, variance also provides insights into how data is spread out.Coefficient of Variation (CV):
The coefficient of variation is the ratio of standard deviation to the mean, often expressed as a percentage. It helps compare the spread between datasets with different units or scales.Z-Score:
A Z-score indicates how many standard deviations a data point is from the mean. It’s helpful for standardizing data and detecting outliers.
When Not to Use Standard Deviation
While standard deviation is useful, it’s not always the best tool:
Skewed Data: If your data is heavily skewed or has many outliers, standard deviation might not be a good reflection of variability. Median or interquartile range (IQR) could be better alternatives.
Categorical Data: Standard deviation only applies to numerical data. If you’re dealing with categorical data (like user types or device categories), you should use other metrics like proportions or frequencies.
Conclusion
Standard deviation is a powerful tool for understanding data variability and detecting anomalies, making it indispensable for data validation in tech companies. However, like any tool, it has its limitations, especially when dealing with skewed data or outliers. By combining standard deviation with other metrics and knowing when not to use it, you can better understand your data and improve system performance.
Follow on LinkedIn